Back Office
Villa Intellia | Private Consulting in Project Management
Project Management Charts
Project Management requires a sound understanding of diagrams and charts and graphs, and how they are used to manage projects, and in particular how they are used in the actual current project that is being managed.
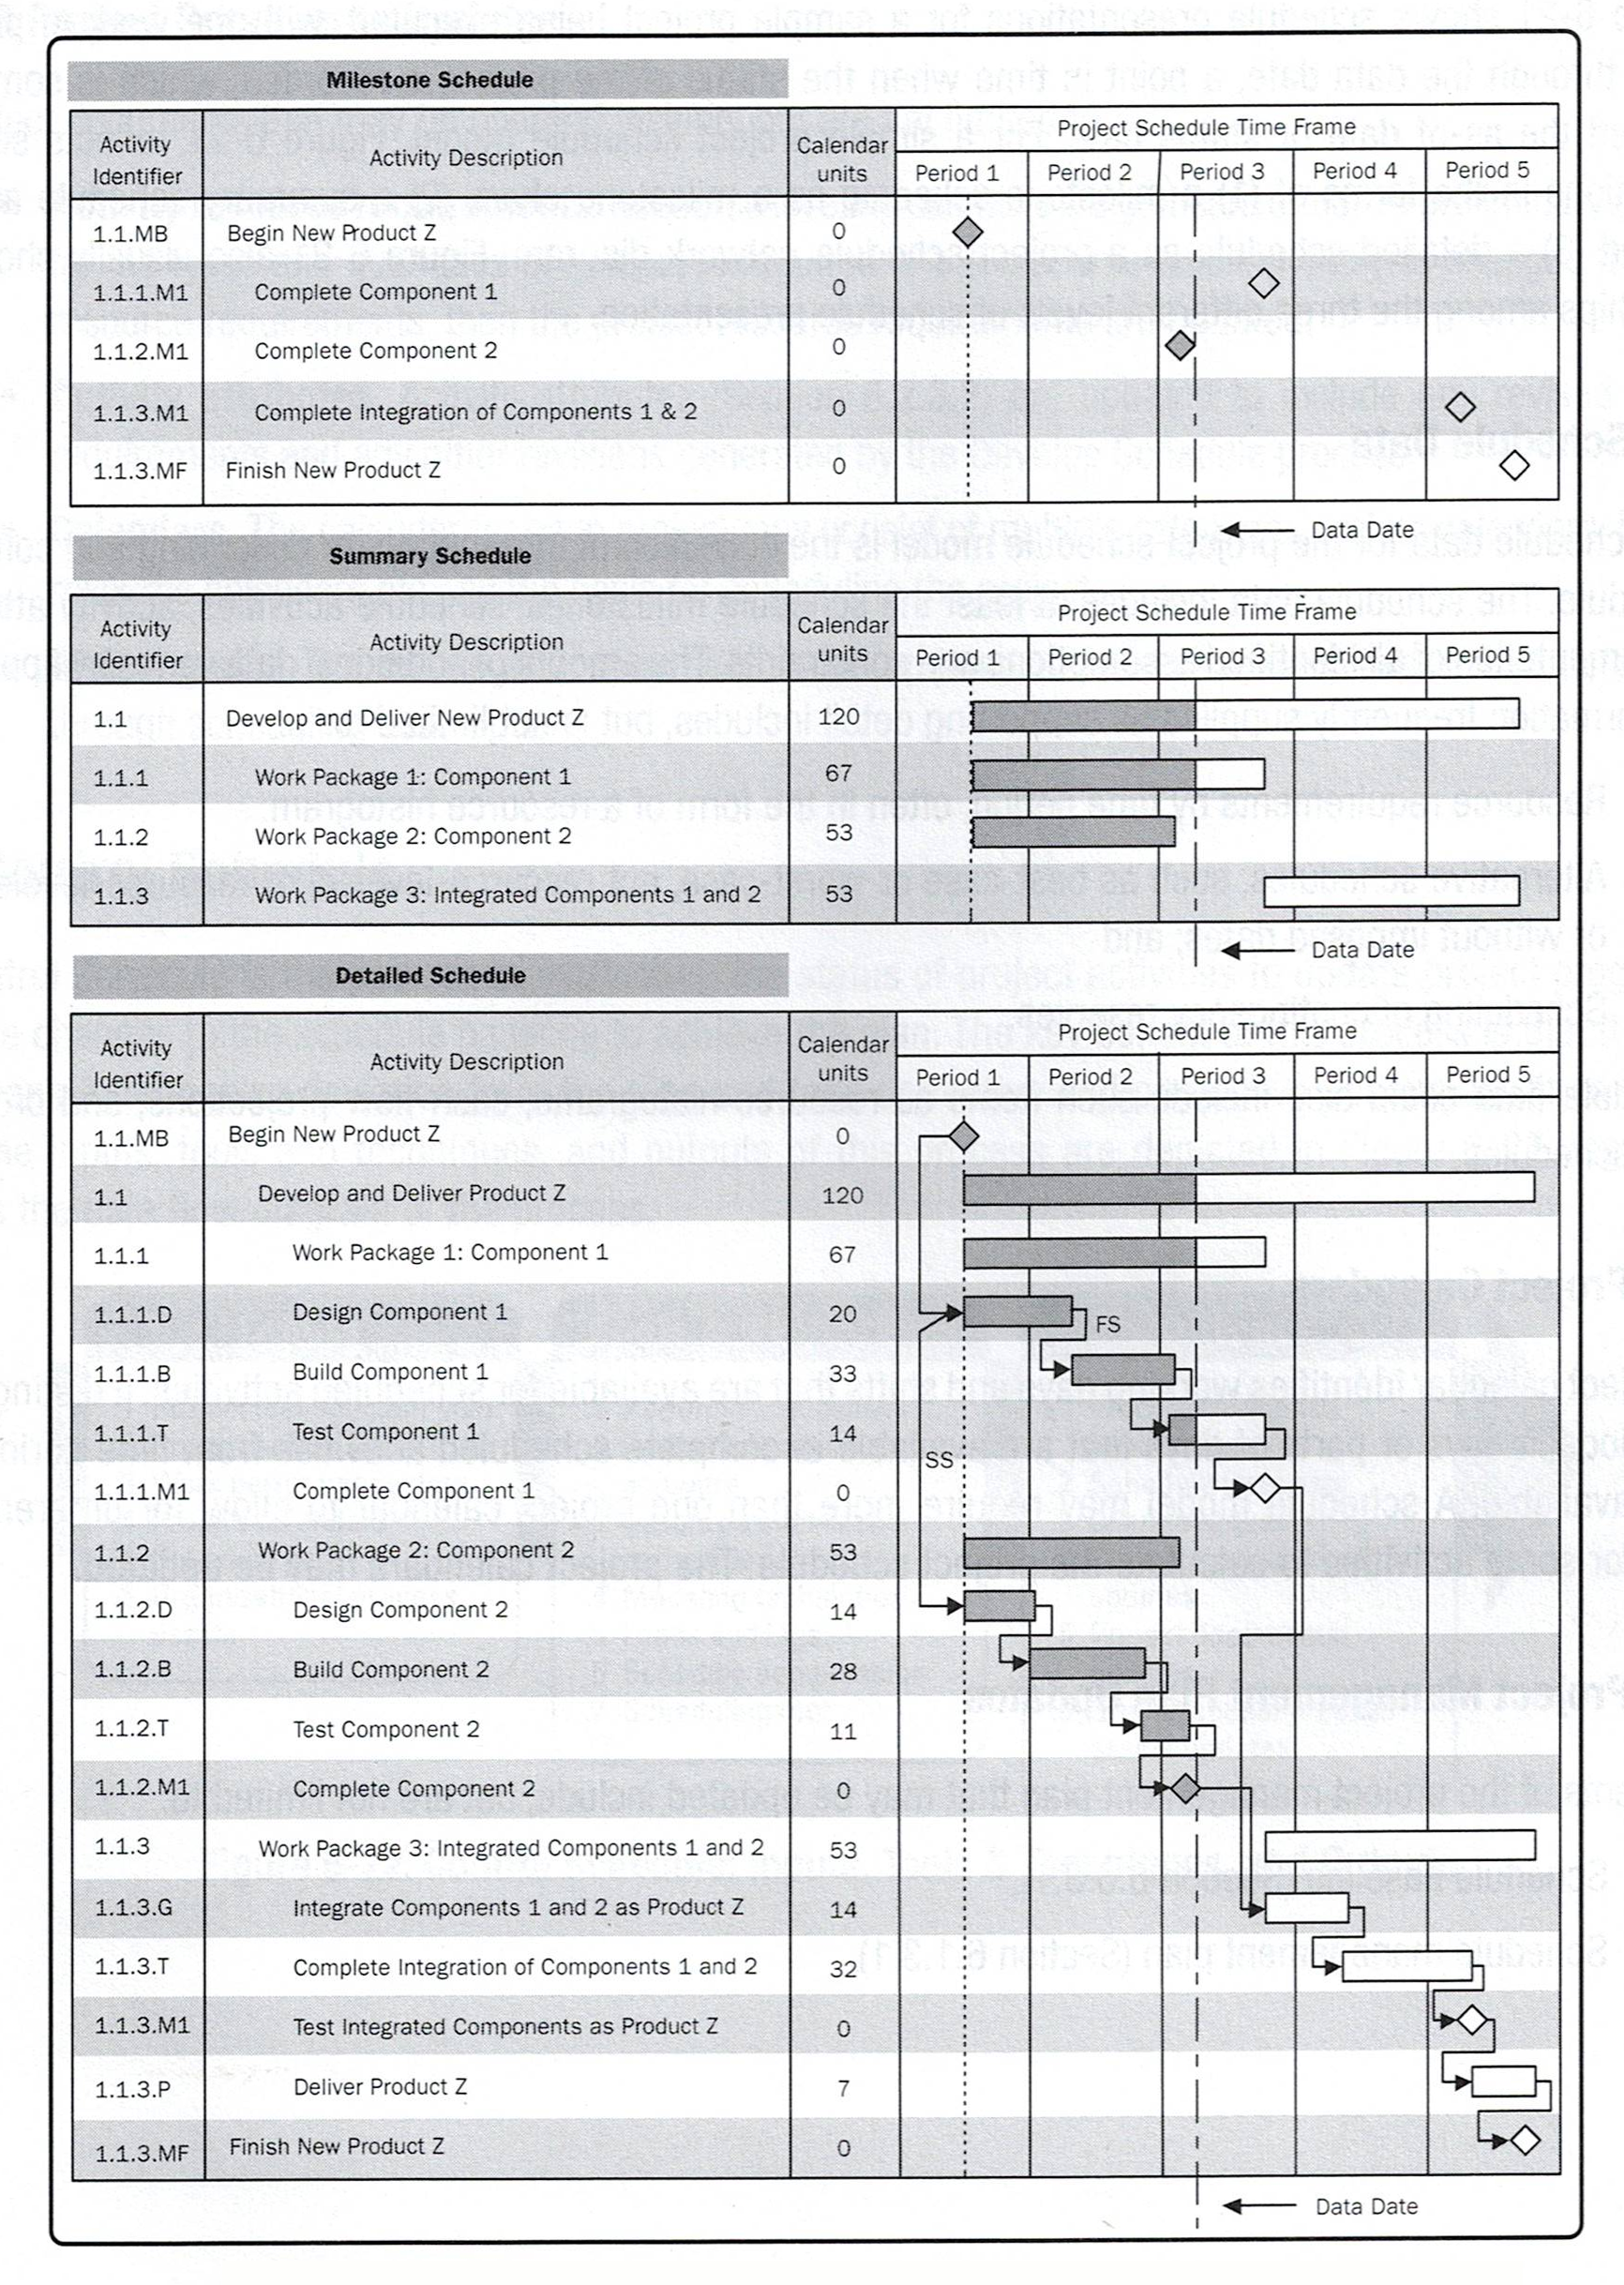
Gantt Chart
A Gantt chart is a project management tool that illustrates work completed over a period of time in relation to the time planned for the work. It typically includes two sections: the left side outlines a list of tasks, while the right side has a timeline with schedule bars that visualize work.
Work Breakdown Structure Diagram
A work breakdown structure (WBS) is a visual, hierarchical and deliverable-oriented deconstruction of a project. It is a helpful diagram for project managers because it allows them to break down their project scope and visualize all the tasks required to complete their projects.

Data Flow Diagram
A flow chart or data flow diagram is a visual aid to understand the methodology you’re using to manage the project. The diagram shows the interdependent and parallel processes over the course of the project’s life cycle. Project managers use a data flow diagram to offer a clear picture of process and to find ways to improve project efficiency.

Kanban Board
Kanban boards are used to manage work at a personal, team, or organizational level. A kanban board is a visualization tool that shows work in progress to help identify bottlenecks and over-commitments, thereby allowing the team to optimize the workflow.

PERT Chart
PERT is also known as Activity Network Diagram. This tool is used to plan the appropriate sequence or schedule for a set of tasks and related subtasks. It is used when subtasks must occur in parallel. The diagram helps in determining the critical path (longest sequence of tasks). The purpose is to help people sequentially define, organize, and manage a complex set of activities. PERT is a method of analyzing the tasks involved in completing a project, especially the time needed to complete each task, and to identify the minimum time needed to complete the total project. It incorporates uncertainty by making it possible to schedule a project while not knowing precisely the details and duration of all the activities. It is more event-oriented than start- and completion-oriented, and is used more for projects where time is the major constraint rather than cost. It is applied to very large-scale, one-time, complex, non-routine infrastructure projects, and R&D projects.

Ishikawa Fishbone Chart
An Ishikawa diagram, also known as interrelationship diagram, is a diagram that shows the causes of an event and is often used in project management to outline the different steps in a process, demonstrate where quality control issues might arise, and determine which resources are required at specific times. Furthermore, the process of creating an interrelationship diagram helps a group analyze the natural links between different aspects of a complex situation.

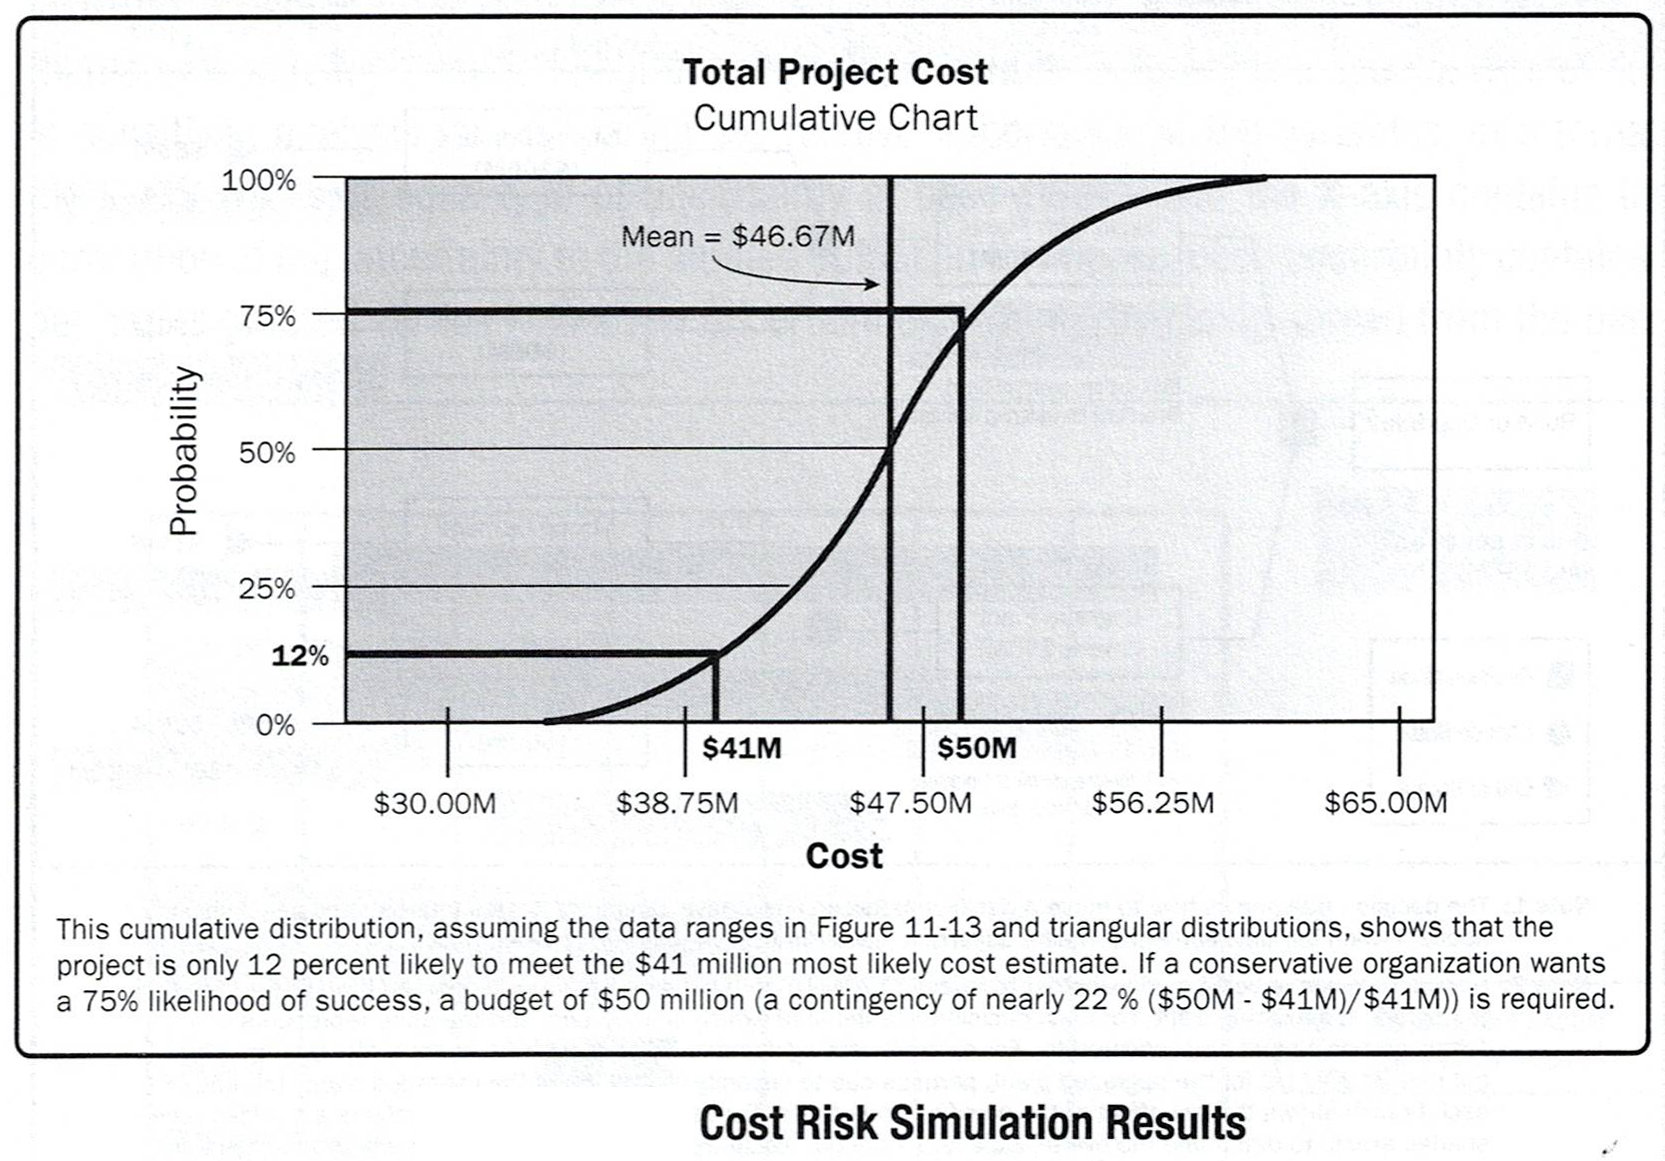
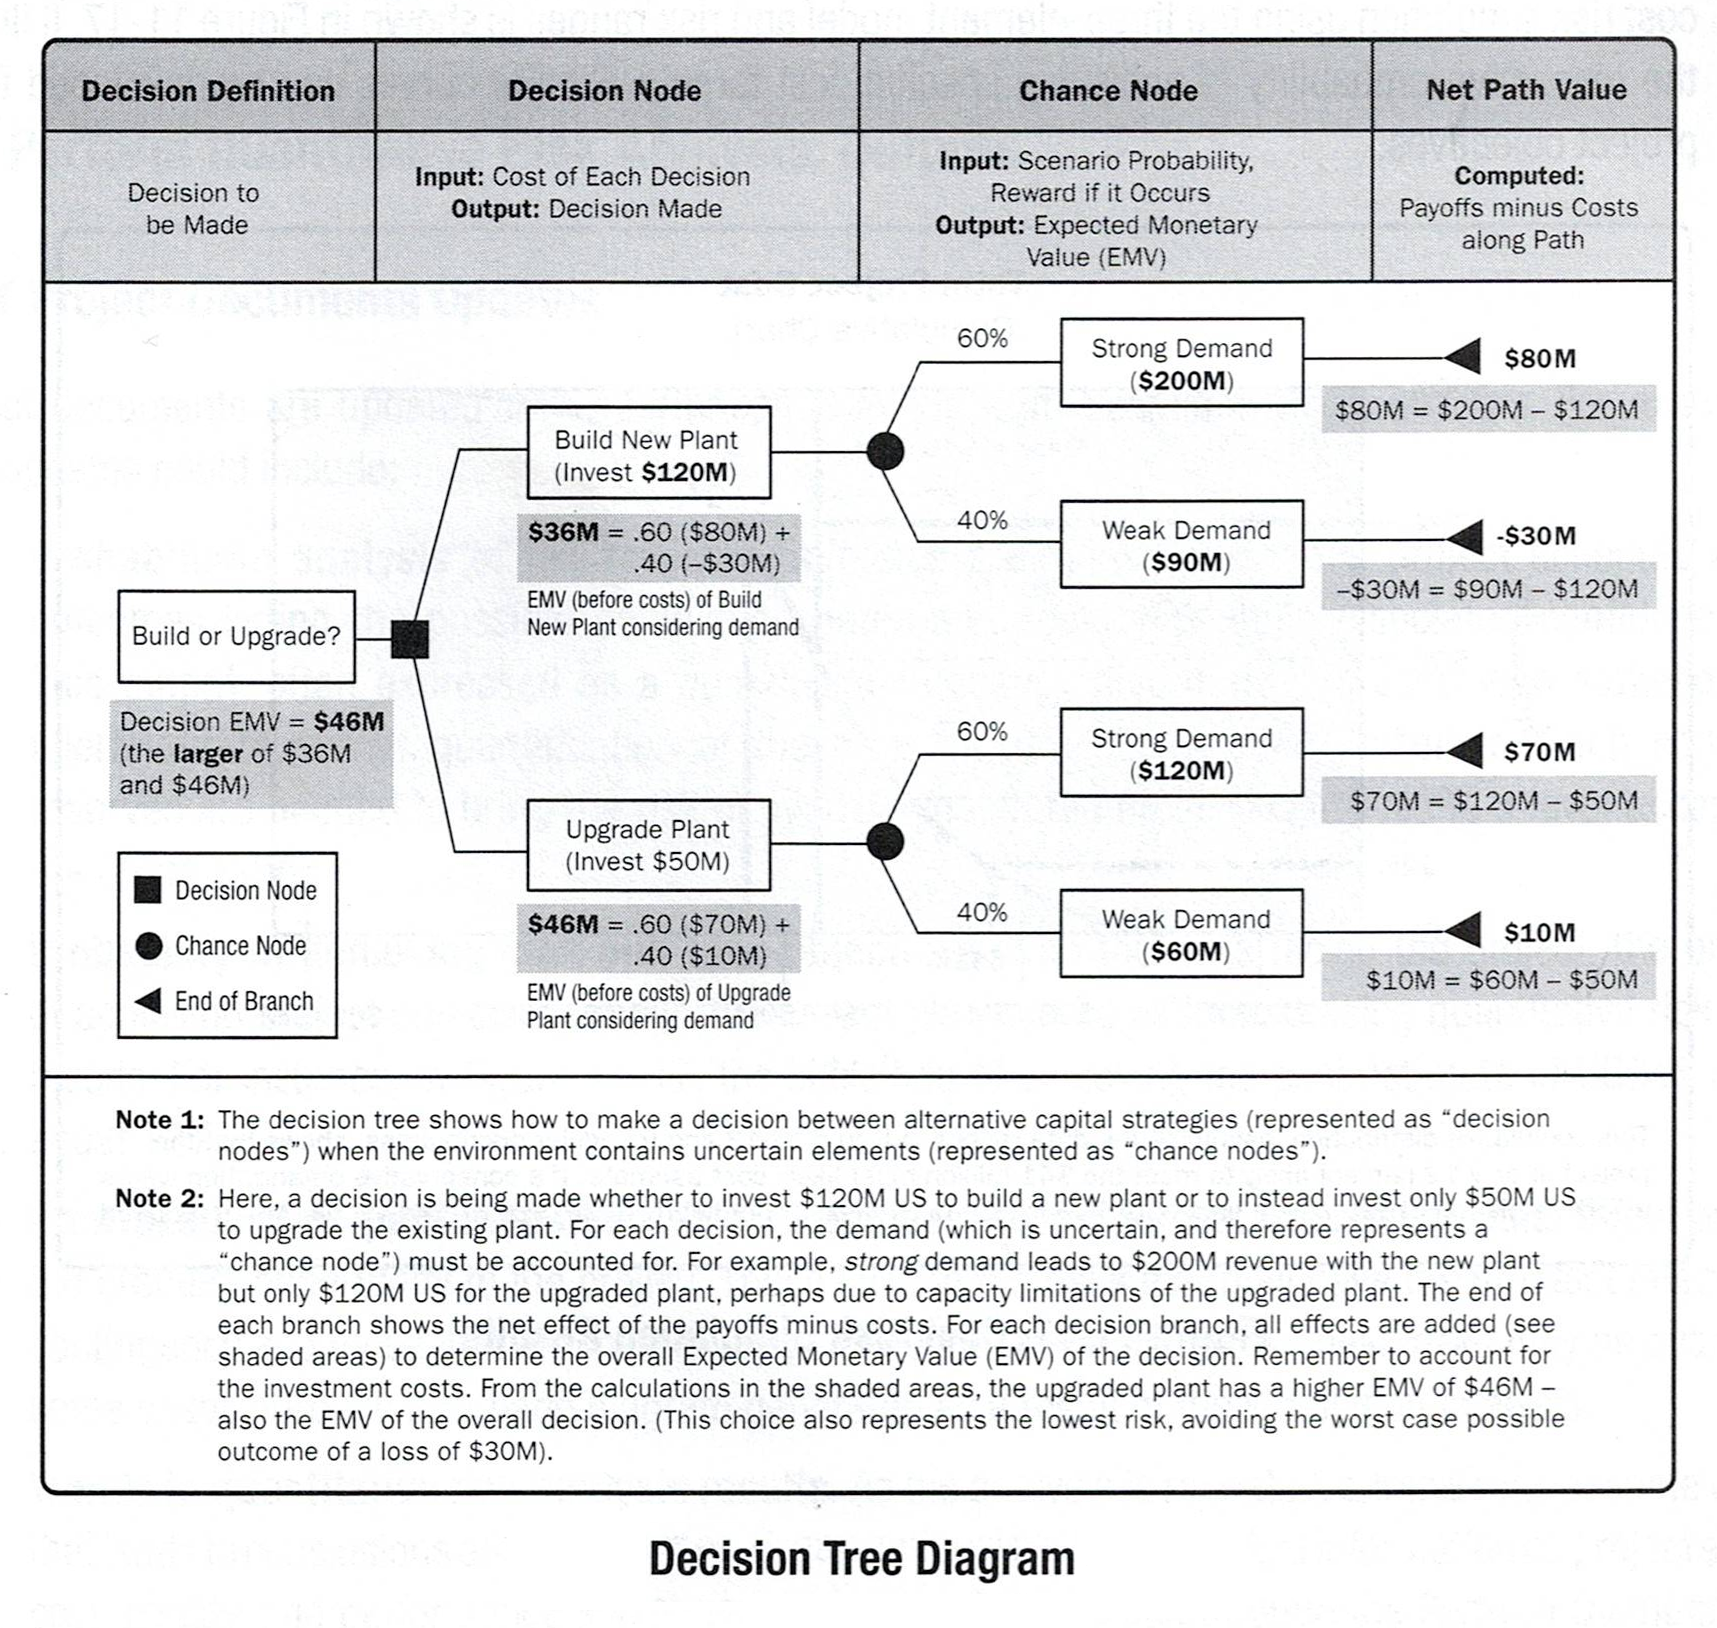
Distribution Graph
A distribution graph shows the range of possible outcomes and their relative likelihood of occurrence.
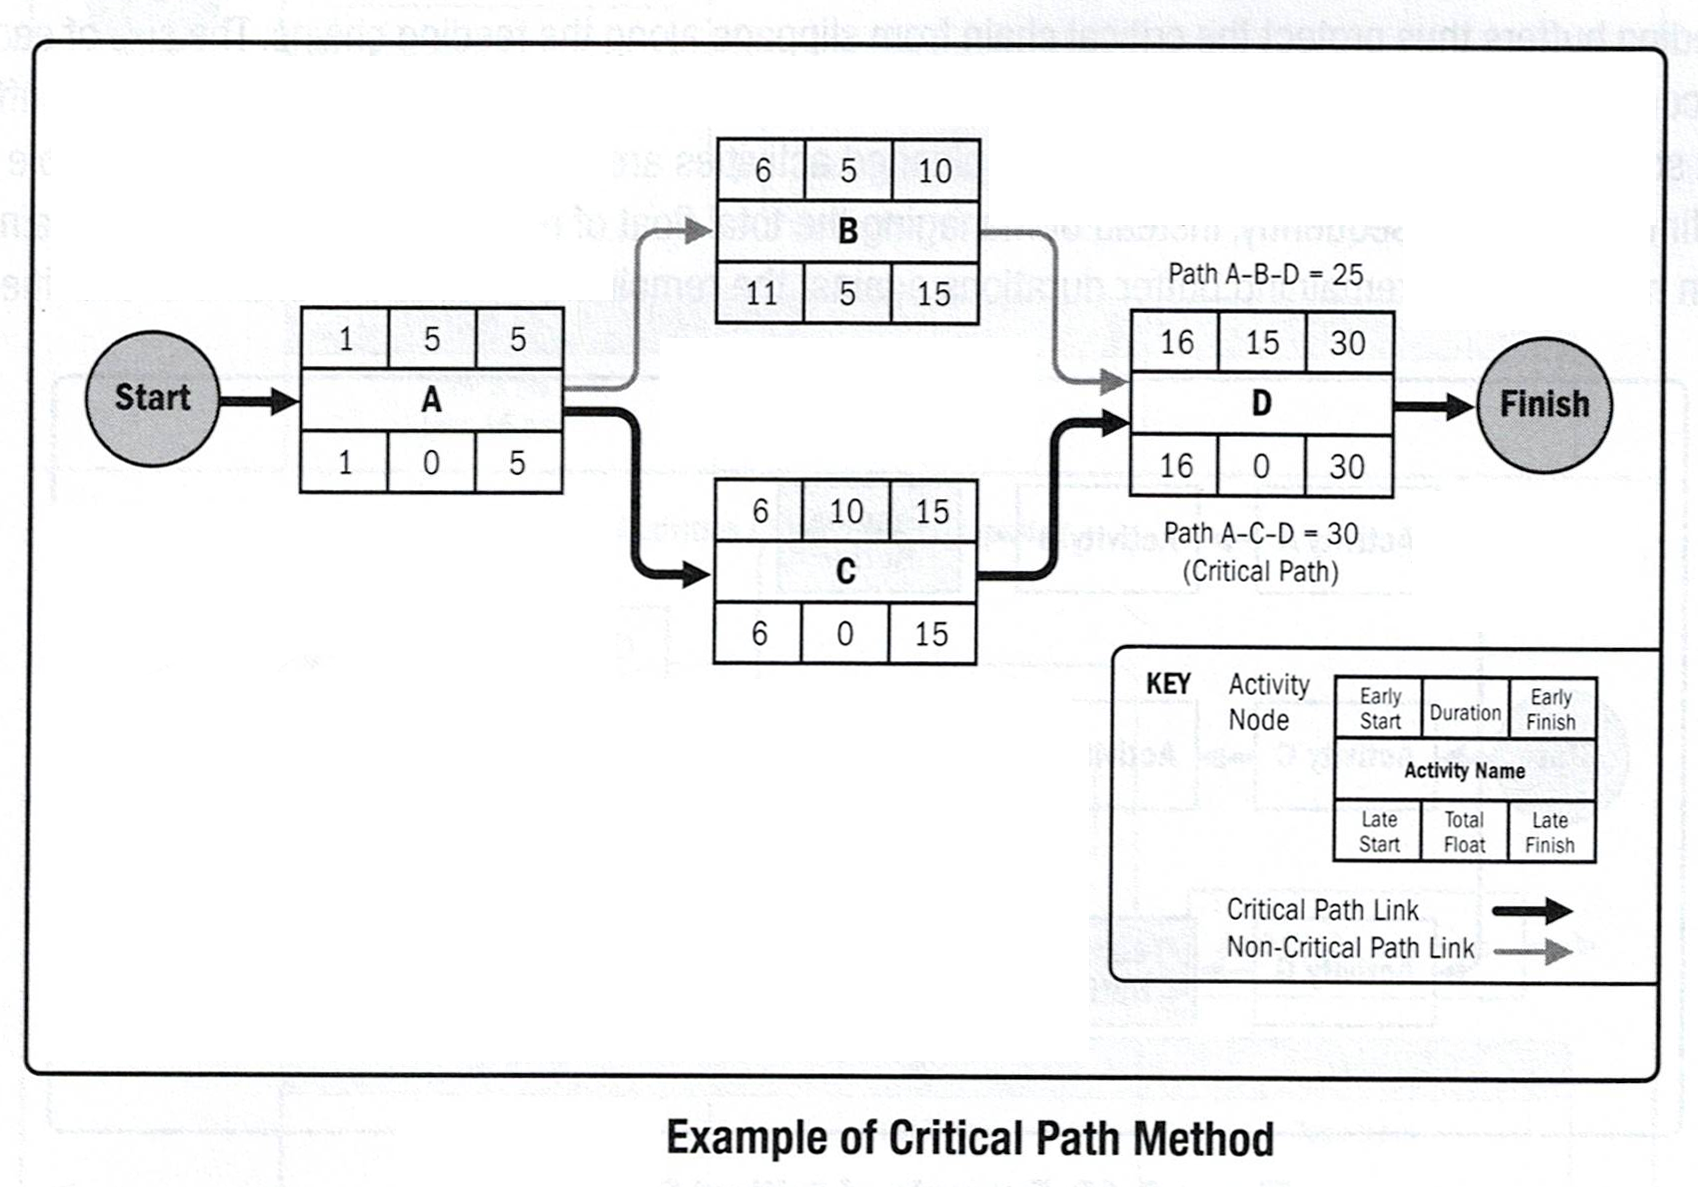
Critical Path Model
The Critical Path Method (CPM) is a vital project management tool that represents the most extended sequence of tasks that must be accomplished to ensure the completion of the entire project. You can determine the critical path by measuring the longest sequence of dependent activities from start to end.
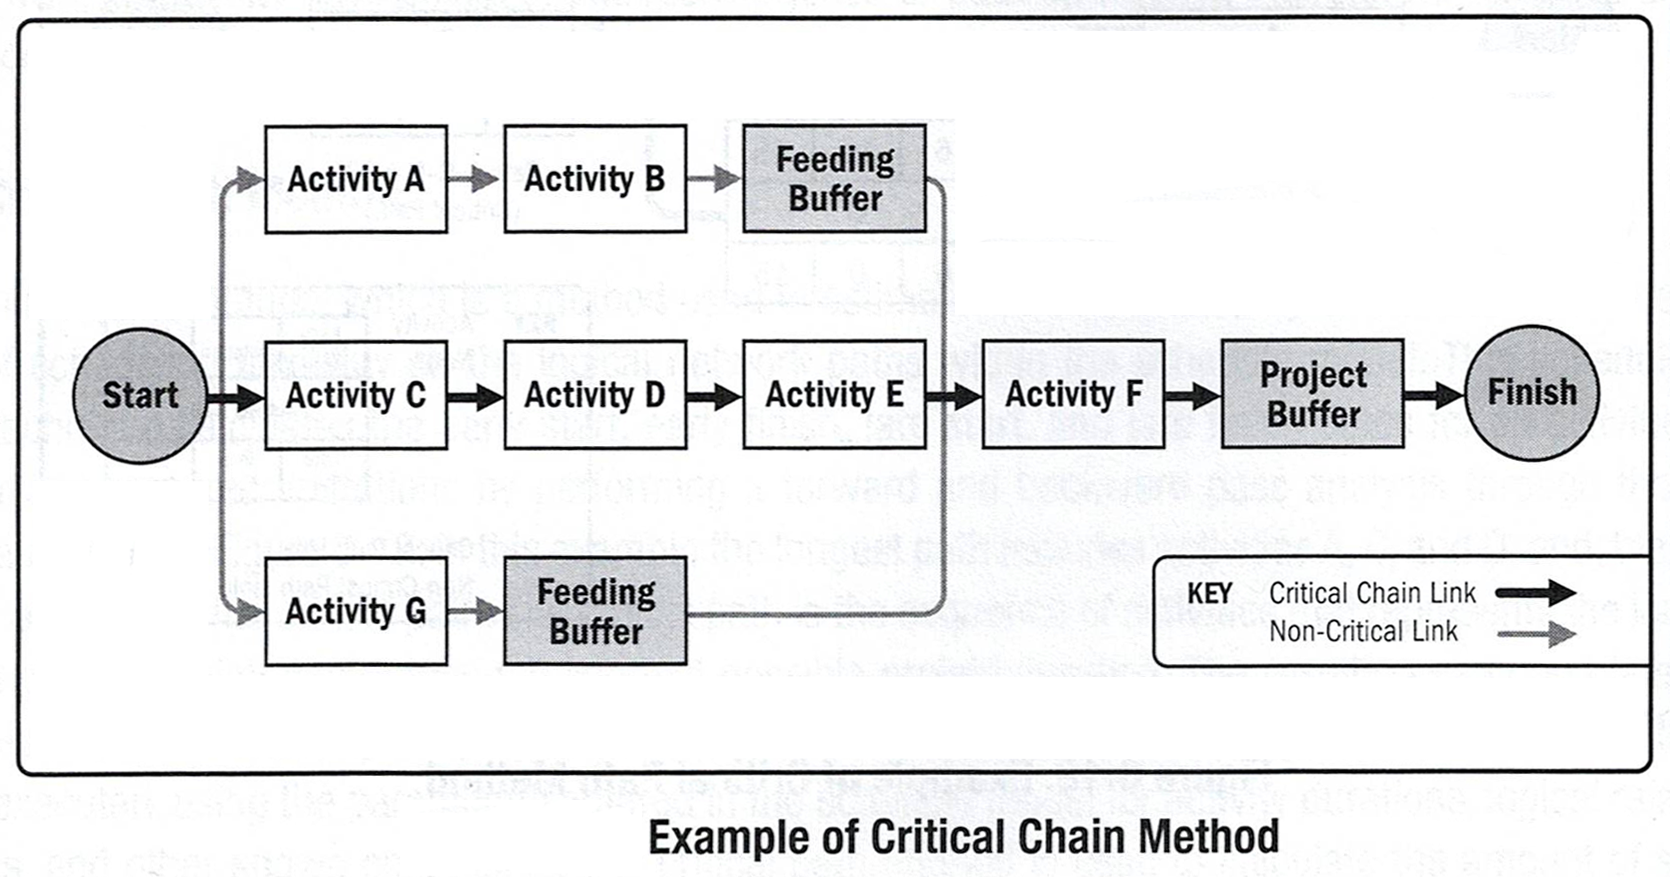
Critical Chain Model
Critical chain project management (CCPM) is a method of planning and managing projects that emphasizes the resources (people, equipment, physical space) required to execute project tasks. It differs from more traditional methods that derive from critical path and PERT algorithms, which emphasize task order and rigid scheduling. A critical chain project network strives to keep resources levelled, and requires that they be flexible in start times. Critical chain project management is based on methods and algorithms derived from Theory of Constraints. The idea of CCPM was introduced in 1997 in Eliyahu M. Goldratt's book, Critical Chain. The application of CCPM has been credited with achieving projects 10% to 50% faster and/or cheaper than the traditional methods (i.e., CPM, PERT, Gantt, etc.) developed from 1910 to 1950s.
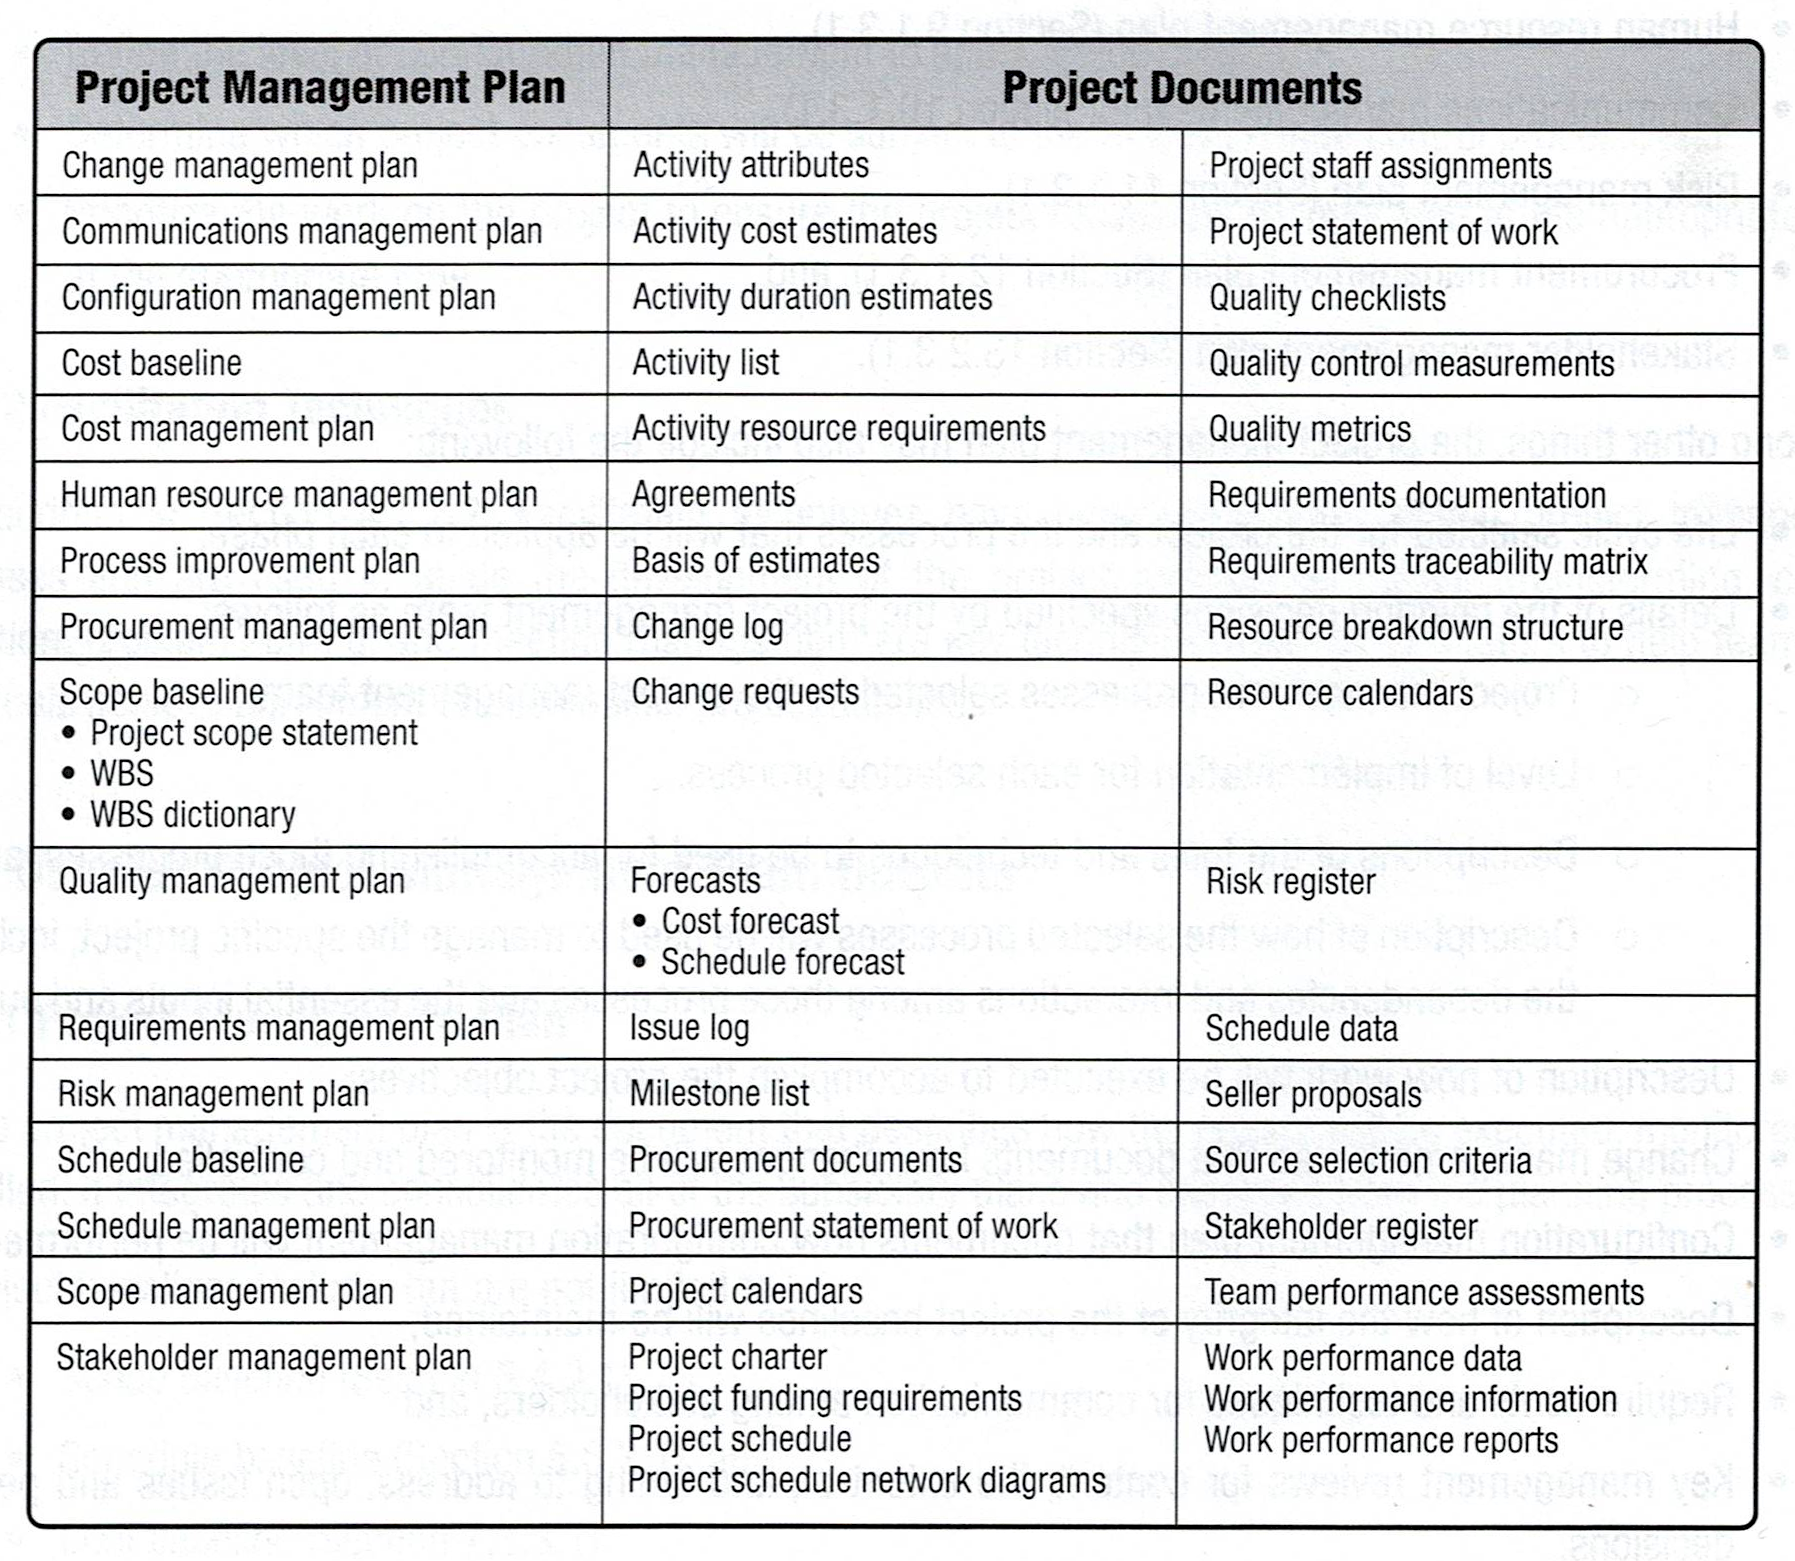
Project Management Plan and Project Documents
The project managment plan is the document that describes how the project will be executed, monitored and controlled. It integrates and consolidates all of the subsidiary plans and baselines from the planning processes.
The project managment plan is either summary level or detailed, and may be composed of one or more subsidiary plans. Each of the subsidiary plans is detailed to the extent required by the specific project. Once the project management plan is baselined, it may only be changed when a change request is generated and approved through the Perform Integrated Change Control process.
While the project management plan is one of the primary documents used to manage the project, other project documents are also used. These other documents are not part of the project management plan but are nevertheless part of the whole of the project documentations.
"Archive all relevant project documents
in the project management information system
to be used as historical data."
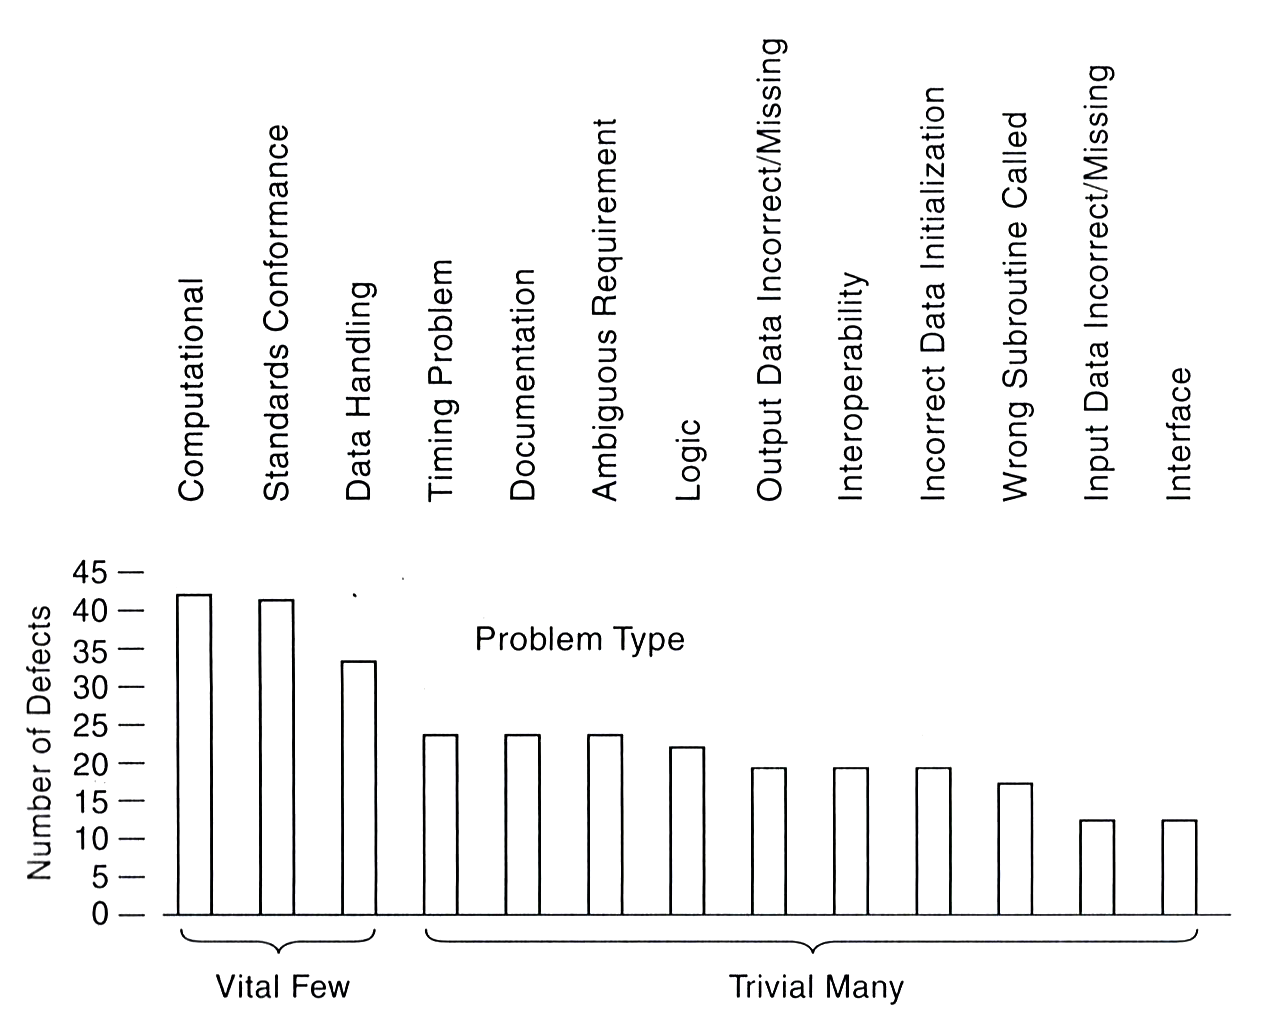
Pareto Chart
A Pareto diagram is an ordered histogram made of a vertical bar chart that identifies the critical few from the uncritical many: A histogram, ordered by frequency of occurrence, that shows how many results were generated by each identified cause. Pareto diagrams are used to identify the vital few sources that are responsible for causing most of a problem’s effects. The categories shown on the horizontal axis exist as a probability distribution that accounts for 100% of the observations. The relative frequencies of each specified cause listed on the horizontal axis decrease in magnitude until a default source named “other” accounts for any non-specified causes. Typically, the Pareto diagram will be organized into categories that measure either frequencies or consequences.
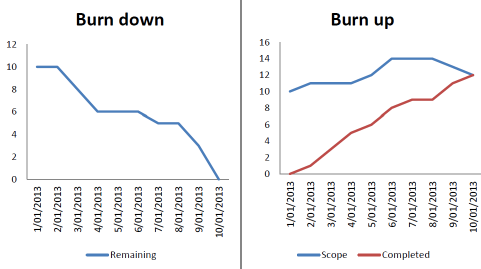
Burndown & Burnup Chart
Burndown charts are a great visual way to track the remaining work on a project. You can track story points completed to get an indication of how your velocity is performing, or effort (in hours usually) to see how your expected completion date compares to your actual/probable one.
Burnup charts are used for a similar purpose, but they hold a key advantage in that it is an easy way to show your client and other stakeholders how much longer the project should take if they want additional work added.
Control Chart
A control chart is by data visualization type a scatter plot or connected scatter plot. As a tool that is used to determine the predictability, behaviour and stability of the process over time. The control chart tool is part of the quality control management and it is a graphic display of the data against established control limits to reflect both the maximum and minimum values and the upper limits and lower limits allowed.. It has a centre-line that helps determine the trend of the plotted values toward the control limits. The control chart has three components which include the centre-line, specification limit and control limits. Calculating the components can help determine whether values have exceeded the specification limits or not. A process is considered as out of control if the calculated data exceeds the control limit or if seven consecutive points are way below or above the mean. Values that exceed the specification limits may incur penalties.

The control chart is necessary for project management as it provides the project manager as well as the stakeholders the ability to determine points which they can implement corrective actions to prevent further problems. This particular tool is developed for processes that are repetitive by nature and that the expectations are set to perform around the variable X wherein the process involves doing the same thing and produces the same expected results.
Affinity Diagram
Affinity diagrams are a special kind of brainstorming tool that organize large amount of disorganized data and information into groupings based on natural relationships. An affinity diagram is used when you are confronted with many facts or ideas in apparent chaos, or when issues seem too large and complex to grasp.
Tree Diagram
This tool is used to break down broad categories into finer and finer levels of detail. It can map levels of details of tasks that are required to accomplish a goal or solution or task. Developing a tree diagram directs concentration from generalities to specifics.
Prioritization Matrix
This tool is used to prioritize items and describe them in terms of weighted criteria. It uses a combination of tree and matrix diagramming techniques to do a pair-wise evaluation of items and to narrow down options to the most desired or most effective.

Matrix Diagram
A matrix diagram is a project management and planning tool for displaying and analyzing the relationships between two or more data sets. At each intersection, a relationship is either absent or present. It then gives information about the relationship, such as its strength, the roles played by various individuals or measurements. The matrix diagram enables you to analyze relatively complex situations by exposing interactions and dependencies between things. Six differently shaped matrices are possible: L, T, Y, X, C, R and roof-shaped, depending on how many groups must be compared.

Process Decision Program Chart (PDPC)
A useful way of planning is to break down tasks into a hierarchy, using a tree diagram. The process decision program chart (PDPC) extends the tree diagram a couple of levels to identify risks and countermeasures for the bottom level tasks. Different shaped boxes are used to highlight risks and identify possible countermeasures (often shown as "clouds" to indicate their uncertain nature). The PDPC is similar to the failure modes and effects analysis (FMEA) in that both identify risks, consequences of failure, and contingency actions; the FMEA also rates relative risk levels for each potential failure point.

Checksheets
Checkcheets are used to organize facts in a manner that will facilitate the effective collection of useful data about a potential quality problem. They are especially useful for gathering attributes data while performing inspections to identify defects. For example, data about the frequencies or consequences of defects collected in checksheets are often displayed in Pareto diagrams.
Flowcharts
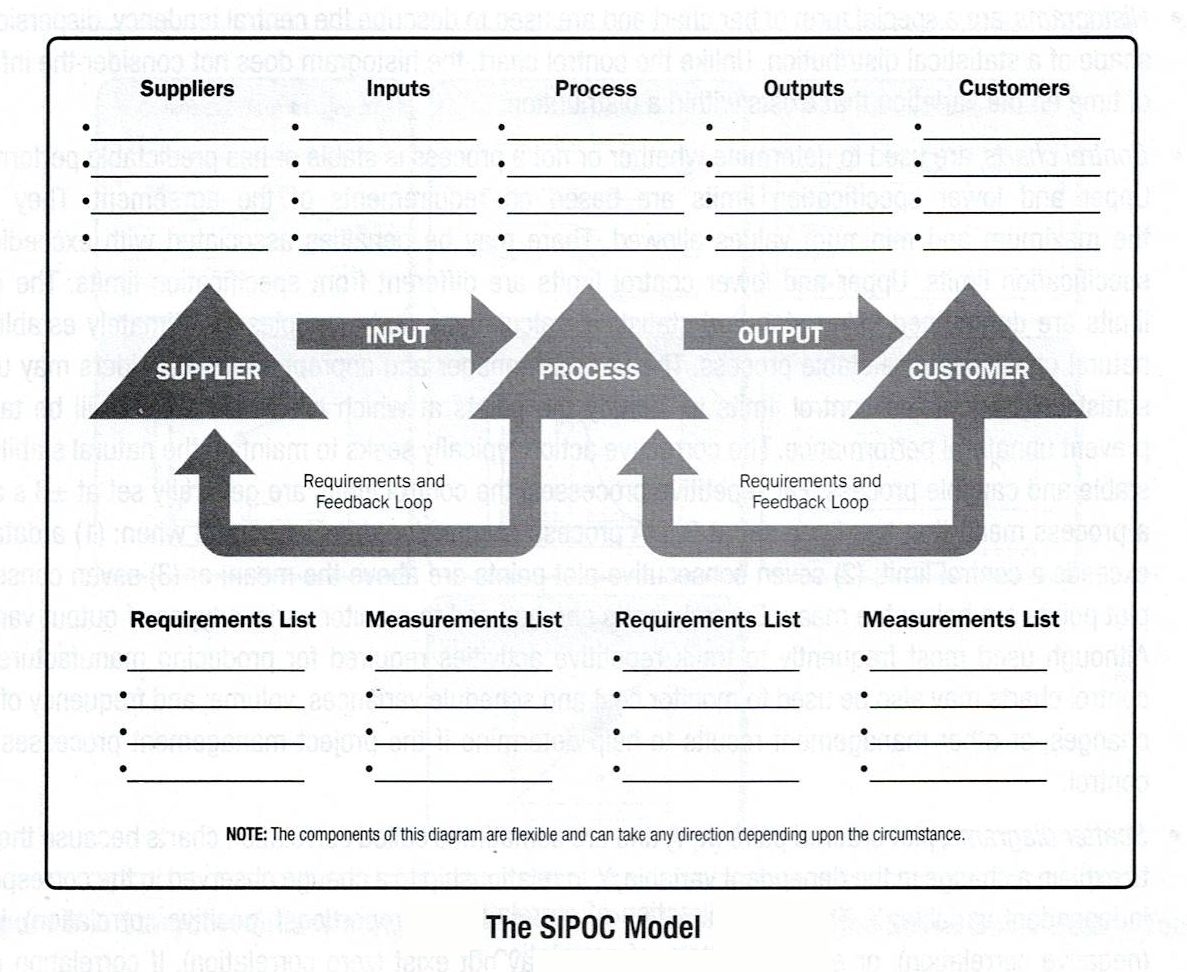
Flowcharts which are also referred to as process maps because they display the sequence of steps and the branching possibilities that exist for a process that transforms one or more inputs into one or more outputs. Flowcharts show the activities, decision points, branching loops, parallel paths, and the overall order of processing by mapping the operational details of procedures that exist within a horizontal value chain of SIPOC model. Flowcharts may prove useful in understanding and estimating the cost of quality in a process. This is obtained by using the workflow branching logic and associated relative frequencies to estimate expected monetary value for the conformance and noncomformance work required to deliver the expected conforming output.
Stakeholders Engagement Assessment Matrix
For the analysis of gaps between the current and desired engagement levels of stakeholders, and the actions and communications required to close these gaps. In the matrix C indicates current engagement, and D indicates desired engagement.

Analysis in Project Management
- Regression Analysis
- Grouping Methods
- Causal Analysis
- Root Cause Analysis
- Forecasting Methods
- Failure Mode and Effect Analysis (FMEA)
- Fault Tree Analysis (FTA)
- Reserve Analysis
- Trend Analysis
- Earned Value Management
- Variance Analysis
- Rolling Wave Planning
- Leads and Lags
- Alternatives Analysis
- Scheduling Techniques
- Estimating Approaches
- Payback Period
- Return on Investment
- Internal Rate of Return
- Discounted Cash Flow
- Net Present Value
- Risk Profile Analysis
- Risk Scoring Sheets
- Procurement and Vendor Analysis
- Stakeholder Engagement Assessment Matrix
Private Consulting
For your Project Management needs and to request our assistance contact Villa Intellia.